boxplot
- boxplot(data: DataFrame, column: str, ax: Optional[Axes] = None, lower_quantile: float = 0, upper_quantile: float = 1, transform: str = 'identity', clip: float = 0, flip_axis: bool = True, **kwargs) Axes
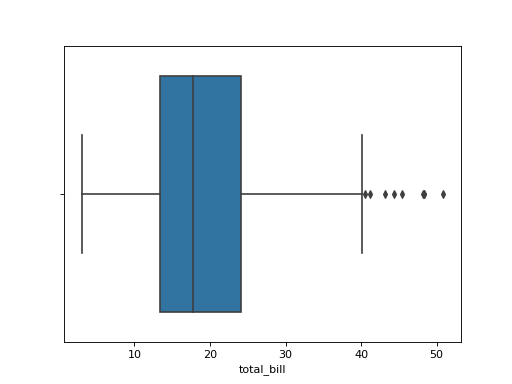
Plots a boxplot of a numerical data column in a pandas DataFrame.
Wraps seaborn’s boxplot adding additional data handling arguments such as log transformations and trimming quantiles to ignore outliers.
- Parameters
data – pandas DataFrame containing data to be plotted
column – name of column to plot histogram of
ax – matplotlib axes generated from blank ggplot to plot onto. If specified, must also specify fig
lower_quantile – Lower quantile to filter data above
upper_quantile – Upper quantile to filter data below
transform –
Transformation to apply to the data for plotting:
’identity’: no transformation
’log’: apply a logarithmic transformation to the data
clip – Value to clip zero values to for log transformation. If 0 (default), zero values are simply removed.
flip_axis – Whether to flip the plot so boxplot is horizontal.
kwargs – Additional keyword arguments passed through to [sns.boxplot](https://seaborn.pydata.org/generated/seaborn.boxplot.html)
- Returns
The axes plot was drawn to
Examples
(Source code, png, hires.png, pdf)